ambari二次开发分享(二)
2024-06-20 11:52:52 # Ambari # 二次开发

ambari二次开发分享(二)

目录

页面上添加修改服务配置

在页面上的配置可以进行修改和添加

configs下面都对应configuration.xml文件中的name和value
可以使用resource_management中获取配置的值

在界面上修改或添加服务配置有三种方式:

方式1 创建模板文件

这个方式只能修改前端页面已经有的参数不能新加参数
alt text

  1. 首先在package目录下创建一个templates的目录,里面存放的就是配置模板

    1
    2
    3
    4
    5
    6
    #!/bin/bash
    elastic_head_base_dir={{elastic_head_base_dir}}
    # modify elasticsearch-head port
    sed -i "s/port:.*/port: {{elasticsearch_head_port}},/g" $elastic_head_base_dir/Gruntfile.js
    # modify elasticsearch-head web ui ip:port
    sed -i "s/http:\/\/.*/http:\/\/{{elasticsearch_service_host}}:{{elasticsearch_port}}\";/g" $elastic_head_base_dir/_site/app.js

    这里的两个花括号里面的变量在params.py文件中已经被定义,这里的问题就是获取配置文件中的elastic_head_base_dir这种配置然后将前端界面更改后的最新配置放到对应的elastic_head_base_dir/Gruntfile.js文件中。这里也就是将前端界面修改的es-head的端口号更新在对应的es的文件中,这就是配置的模板

  2. 将模板内的内容放入到新的配置文件中

    1
    2
    3
    4
    5
    6
    7
    8
    File(os.path.join(params.tmp_dir, 'changeHostName.sh'),
    owner=params.elastic_user,
    group=params.user_group,
    mode=0644,
    content=Template("changeHostName.sh.j2")
    )
    cmd = format("cd {tmp_dir}; sh ./changeHostName.sh")
    Execute(cmd, user=params.elastic_user)

    这里的内容是放在head.py中的configure的配置方法中的,先创建一个临时目录tmp,然后创建一个叫changeHostName.sh的脚本,再将模板中的内容放在这个脚本中,运行这个脚本

    这里在start方法中需要调用这个方法,保证在程序启动的时候就先运行一下这个脚本的内容,将最新的配置更新在es的对应文件中

alt text

这里结合前面的更改某一个参数就会指定必须重启,这里可以设置更改这个参数服务必须重启
  1. 需要修改的配置必须在configuration/xxx.xml文件中定义,可以前端展示看见这个配置

方式2 大文本框修改配置

这种方式可以增加新的配置,类似于下面的内容将这个配置在elastic-config.xml中配置,注意这里必须是<type>content</type>
alt text

1
2
3
4
5
6
7
8
9
10
11
12
13
14
15
16
17
18
19
20
21
22
23
24
25
26
27
28
29
30
31
32
33
34
35
36
37
38
39
40
41
42
43
44
45
46
47
48
49
50
51
52
53
54
55
56
57
58
59
60
61
62
63
64
65
66
67
68
69
70
71
72
73
74
75
76
77
78
79
80
81
82
83
84
85
86
<property>
<name>content</name>
<display-name>Elasticsearch config file template</display-name>
<description>This is the template for elasticsearch.yml file</description>
<value>
# ======================== Elasticsearch Configuration =========================
#
# NOTE: Elasticsearch comes with reasonable defaults for most settings.
# Before you set out to tweak and tune the configuration, make sure you
# understand what are you trying to accomplish and the consequences.
#
# The primages/ambari二次开发二/imary way of configuring a node is via this file. This template lists
# the most important settings you may want to configure for a production cluster.
#
# Please see the documentation for further information on configuration options:

# ---------------------------------- Cluster -----------------------------------
# Use a descriptive name for your cluster:
cluster.name: {{cluster_name}}

# ------------------------------------ Node ------------------------------------
# Use a descriptive name for the node:
node.name: {{hostname}}

# Add custom attributes to the node:
node.attr.rack: {{node_attr_rack}}

# ----------------------------------- Paths ------------------------------------
# Path to directory where to store the data (separate multiple locations by comma):
path.data: {{path_data}}

# Path to log files:
path.logs: {{elastic_log_dir}}

# ----------------------------------- Memory -----------------------------------
#
# Lock the memory on startup:
#
bootstrap.memory_lock: {{bootstrap_memory_lock}}

# ---------------------------------- Network -----------------------------------
# Set the bind address to a specific IP (IPv4 or IPv6):
network.host: {{hostname}}

# Set a custom port for HTTP:
http.port: {{elasticsearch_port}}
transport.tcp.port: 9300

# ----------------------------------- Head Requires -----------------------------------
http.cors.enabled: {{http_cors_enabled}}
http.cors.allow-origin: "{{http_cors_allow_origin}}"
# --------------------------------- Discovery ----------------------------------
# Pass an initial list of hosts to perform discovery when new node is started:
# The default list of hosts is ["127.0.0.1", "[::1]"]
discovery.zen.ping.unicast.hosts: {{discovery_zen_ping_unicast_hosts}}

# Prevent the "split brain" by configuring the majority of nodes (total number of nodes / 2 + 1):
discovery.zen.minimum_master_nodes: {{discovery_zen_minimum_master_nodes}}

# ---------------------------------- Gateway -----------------------------------
#
# Block initial recovery after a full cluster restart until N nodes are started:
#
gateway.recover_after_nodes: {{gateway_recover_after_nodes}}
#
# For more information, consult the gateway module documentation.
#
# ---------------------------------- Various 123-----------------------------------
#
# Require explicit names when deleting indices:
#
action.destructive_requires_name: {{action_destructive_requires_name}}
{% if ping_timeout_default %}
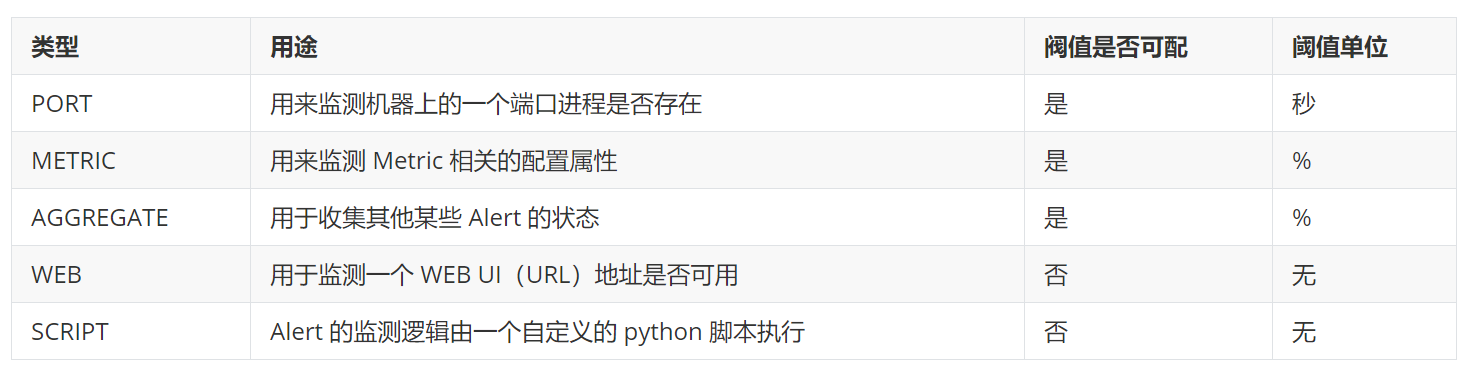
{% else %}
discovery.zen.ping_timeout: {{discovery_zen_ping_timeout}}s
{% endif %}
</value>
<value-attributes>
<type>content</type>
<show-property-name>true</show-property-name>
</value-attributes>
<on-ambari-upgrade add="true"/>
</property>


这里的配一个动态的内容都用{{}}来表示,前端界面会文本的格式供用户去修改和展示

这里我们的修改方式是通过InlineTemplate()的方式去获得属性内变量转换的值然后用File方法将配置文件的内容覆盖到服务的配置文件中

1
2
3
4
5
elasticsearch_yml = InlineTemplate(params.elasticsearch_yml)
File(format("{elastic_conf_base_dir}/elasticsearch.yml"),
owner=params.elastic_user,
group=params.elastic_group,
content=elasticsearch_yml)

方式三 利用 Advance 和 Custom xxx 来修改或添加服务配置

方式二的大文本框不够美观,而且等于是把配置文件的内容全部展示出来了,所以这里也可以使用这种方式三来做

alt text

ambari的配置中会有这种Advance和Custom的配置,一般来说Advance是只能更改不能添加的配置,Custom中是可以添加的配置

我们可以在Custom中添加Name和Value

alt text
alt text

这里的实现后续测试后将单独更新

调试打印日志

主要使用的是resource_management.core.logger.py这个方法来打印日志

日志引入

1
2
3
from resource_management.core.logger import Logger 

Logger.info("Starting sample Service")

打印参数

params.py中来获取各种变量

  1. 获取Config内容配置

    我们可以先看一下这个get_config()中有什么

    1
    2
    3
    config = Script.get_config()
    config_str = ",".join(config)
    Logger.info(config_str)

    得到的结果是

    1
    commandParams,clusterName,localComponents,clusterId,commandType,agentLevelParams,taskId,componentVersionMap,commandId,serviceLevelParams,requiredConfigTimestamp,ambariLevelParams,repositoryFile,configurationAttributes,componentLevelParams,hostLevelParams,clusterLevelParams,roleCommand,serviceName,role,requestId,configurations,clusterHostInfo

    这里可以看到Config中获取到的所有内容,接下来我们进入每一个内容的细节进行查看

  2. 获取clusterHostInfo 配置

    1
    2
    3
    config = Script.get_config()
    clusterHostInfo_str = str(config['clusterHostInfo'])
    Logger.info(clusterHostInfo_str)

    得到的结果是

    1
    {u'hbase_regionserver_hosts': [u'node131.data', u'node133.data'], u'metrics_collector_hosts': [u'node133.data'], u'all_ipv4_ips': [u'192.168.162.131', u'192.168.52.133'], u'elasticsearch_head_hosts': [u'node131.data'], u'secondary_namenode_hosts': [u'node133.data'], u'elasticsearch_service_hosts': [u'node131.data'], u'all_hosts': [u'node131.data', u'node133.data'], u'hdfs_client_hosts': [u'node131.data', u'node133.data'], u'metrics_monitor_hosts': [u'node131.data', u'node133.data'], u'all_racks': [u'/default-rack', u'/default-rack'], u'zookeeper_client_hosts': [u'node131.data', u'node133.data'], u'namenode_hosts': [u'node131.data'], u'metrics_grafana_hosts': [u'node133.data'], u'hbase_client_hosts': [u'node131.data', u'node133.data'], u'zookeeper_server_hosts': [u'node131.data'], u'hue_server_hosts': [u'node131.data'], u'hbase_master_hosts': [u'node131.data'], u'datanode_hosts': [u'node131.data', u'node133.data']}

    这里我们可以看到这里输出的是我们安装的所有组件的主机名列表,比如elasticsearch_service_hosts这个key的前半部分elasticsearch_service我们metainfo.xml中自定义的name值,后半部分_hosts是host主机名

    1
    config['clusterHostInfo']['datanode_hosts']

    获取到的内容是

    1
    [u'node131.data', u'node133.data']
  3. 获取configurations配置
    这个配置会输出我们安装的服务的所有的configuration下的xml文件名

    1
    {u'elastic-config': {u'node_attr_rack': u'/default-rack', u'elasticsearch_head_port': u'9102', u'http_cors_allow_origin': u'*', u'path_data': u'/elasticsearch/data', ...}

    通过

    1
    config['configurations']['elastic-config']['node_attr_rack'] 

    来获取对于服务的对于属性的value的值,这里就可以在我们自定义服务的时候就可以获取到其他服务的配置了

  4. 获取其他配置
    其他还有很多配置,这里就不一一列出了,下面列出一些常使用的配置

    1
    2
    3
    4
    5
    6
    7
    8
    9
    10
    11
    12
    13
    14
    15
    16
    17
    # 结果:/var/lib/ambari-agent/tmp 	
    tmp_dir = Script.get_tmp_dir()

    # 结果:/usr/hdp
    stack_root = Script.get_stack_root()

    # 结果:3.1.0.0-78
    version = default("/commandParams/version", None)

    # 结果:3.1
    stack_version = default("/clusterLevelParams/stack_version", None)

    # 结果:HDP
    stack_name = default("/clusterLevelParams/stack_name", None)

    # 获取java_home
    java_home = config['ambariLevelParams']['java_home']

代码调试步骤

ambari是主从架构,ambari会将源码的package部分发到agent的目录下.

当代码调试好以后,package 部分可以移动到 组件主机所在的 /var/lib/ambari-agent/cache/stacks/HDP/3.1/services/ELASTICSEARCH 目录下,可以立即生效

package 之外的部分,必须移动到 ambari-server 主机所在的 /var/lib/ambari-server/resources/stacks/HDP/3.1/services/ELASTICSEARCH 目录下,并且重启ambari-server服务,如果新代码未生效,尝试重装服务

如果是修改 SCRIPT 类型的 py 文件,则只需要将修改后的 py 文件放置到 告警组件所在机器的 /var/lib/ambari-agent/cache/stacks/HDP/3.1/services/ELASTICSEARCH/package/alerts 目录下即可

添加自定义告警

Ambari中主要有两个概念一个是Alert Definition,一个是Alert Instance

Alert Definition 就是告警的定义,其中会定义告警的检测时间间隔(interval)、类型(type)、以及阈值(threshold)等。
Alert Instance 就是告警的实例:Ambari 会读取 alert definition,然后创建对应的实例(instance)去定期执行这个告警。

告警的Alert类型

Ambari 中的 alert 分为 5 种类型,分别是 WEB、Port、Metric、Aggregate 和 Script。

Alert 的检查结果会以五种级别呈现,分别是 OK、WARNING,CRITICAL、UNKNOWN 和 NONE。其中最常见的是前三种。

alt text

Alert实例调用

这里的实例调用都在alerts.json文件中
这里的alerts.json文件的路径是在/var/lib/ambari-server/resources/common-services/AMBARI_METRICS/0.1.0/alerts.json

整体alerts.json文件

整体内容贴在下面可以参照修改

1
2
3
4
5
6
7
8
9
10
11
12
13
14
15
16
17
18
19
20
21
22
23
24
25
26
27
28
29
30
31
32
33
34
35
36
37
38
39
40
41
42
43
44
45
46
47
48
49
50
51
52
53
54
55
56
57
58
59
60
61
62
63
64
65
66
67
68
69
70
71
72
73
74
75
76
77
78
79
80
81
82
83
84
85
86
87
88
89
90
91
92
93
94
95
96
97
98
99
100
101
{
"ELASTICSEARCH": {
"service": [],
"ELASTICSEARCH_SERVICE": [
{
"name": "elasticsearch_server_process",
"label": "elasticsearch服务进程",
"description": "如果您不能确定Elasticsearch服务器进程已启动并且正在网络上侦听,则将触发此主机级别警报。",
"interval": 1,
"scope": "ANY",
"enabled": true,
"source": {
"type": "PORT",
"uri": "{{elastic-config/elasticsearch_port}}",
"default_port": 9200,
"reporting": {
"ok": {
"text": "TCP OK - {0:.3f}s response on port {1}"
},
"warning": {
"text": "TCP OK - {0:.3f}s response on port {1}",
"value": 1.5
},
"critical": {
"text": "Connection failed: {0} to {1}:{2}",
"value": 5
}
}
}
}
],
"ELASTICSEARCH_HEAD": [
{
"name": "elasticsearch_head_process",
"label": "elasticsearch-head服务进程",
"description": "如果无法确定elasticsearch-head进程已开始并且正在网络上侦听,则将触发此主机级别警报。",
"interval": 1,
"scope": "ANY",
"enabled": true,
"source": {
"type": "PORT",
"uri": "{{elastic-config/elasticsearch_head_port}}",
"default_port": 9100,
"reporting": {
"ok": {
"text": "TCP OK - {0:.3f}s response on port {1}"
},
"warning": {
"text": "TCP OK - {0:.3f}s response on port {1}",
"value": 1.5
},
"critical": {
"text": "Connection failed: {0} to {1}:{2}",
"value": 5
}
}
}
},
{
"name": "es_head_webui",
"label": "elasticsearch-head界面",
"description": "如果无法访问Elasticsearch Head Web UI,则会触发此报警。",
"interval": 1,
"scope": "ANY",
"source": {
"type": "WEB",
"uri": {
"http": "{{elastic-config/elasticsearch_head_port}}",
"https": "{{elastic-config/elasticsearch_head_port}}",
"https_property": "http",
"https_property_value": "https",
"connection_timeout": 6.0,
"default_port": 2345
},
"reporting": {
"ok": {
"text": "HTTP {0} response in {2:.3f}s"
},
"warning": {
"text": "HTTP {0} response from {1} in {2:.3f}s ({3})"
},
"critical": {
"text": "Connection failed to {1} ({3})"
}
}
}
},
{
"name": "es_head_check_process",
"label": "检查elasticsearch-head进程",
"description": "检查elasticsearch-head服务进程",
"interval": 1,
"scope": "ANY",
"source": {
"type": "SCRIPT",
"path": "HDP/3.1/services/ELASTICSEARCH/package/alerts/alert_check_dir.py"
}
}
]
}
}

这里的alerts.json文件都依赖于metainfo.xml文件,分为service.name和component.name,表示的是这个组件下的告警

PORT类型

1
2
3
4
5
6
7
8
9
10
11
12
13
14
15
16
17
18
19
20
21
22
23
24
25
26
{
"name": "elasticsearch_server_process",
"label": "elasticsearch服务进程",
"description": "如果您不能确定Elasticsearch服务器进程已启动并且正在网络上侦听,则将触发此主机级别警报。",
"interval": 1,
"scope": "ANY",
"enabled": true,
"source": {
"type": "PORT",
"uri": "{{elastic-config/elasticsearch_port}}",
"default_port": 9200,
"reporting": {
"ok": {
"text": "TCP OK - {0:.3f}s response on port {1}"
//这里的{0:.3f}表示的是响应时间,保留小数点后后三位数字,这里的{1}表示的是端口号
},
"warning": {
"text": "TCP OK - {0:.3f}s response on port {1}",
"value": 1.5
},
"critical": {
"text": "Connection failed: {0} to {1}:{2}",
"value": 5
}
}
}

PORT告警实例解析

  1. name 为告警名称,可以用一个或多个单词表示。
  2. label 为告警的显示名称。
  3. description 为告警描述。如果要汉化告警描述的话,可以修改这里的值。
  4. interval 为告警检测周期,单位为分钟。
  5. scope 为告警范围。分别为 SERVICE、HOST、ANY 。
  6. enabled 为是否启用告警。
  7. source 为告警实例,其中包括:
  8. type:告警类型。这里是 PORT 。
  9. uri:定义参数,这里需要填变量。比如:NaN 。即代表 elastic-config.xml 文件下的 elasticsearch_port 参数值,程序会自动获取真实值。
  10. default_port:监测告警的默认端口号。如果 uri 参数失效,就会读取该参数。
  11. reporting:代表告警级别,分别是 OK、WARNING,CRITICAL、UNKNOWN 和 NONE 。常用的主要为前三种。text 表示告警级别的描述信息;value 的值为 数值类型 ,单位为 秒。代表超过该阈值,则呈现不同的告警级别。

WEB类型

1
2
3
4
5
6
7
8
9
10
11
12
13
14
15
16
17
18
19
20
21
22
23
24
25
26
27
28
29
{
"name": "es_head_webui",
"label": "Es Head Web UI",
"description": "This host-level alert is triggered if the Es Head Web UI is unreachable.",
"interval": 1, // 单位:分钟
"scope": "ANY",
"source": {
"type": "WEB",
"uri": {
"http": "{{elastic-config/elasticsearch_head_port}}", // 可直接追加端口号,参数变量用{{}}标识,当前发现只识别configuration目录下的xml文件内的属性。如果参数变量不符合语法,就会读取https。
"https": "{{elastic-config/elasticsearch_head_port}}",
"https_property": "http", // 当这里值是http时,就检测http链接;当这里值是https时,就检测的https链接。
"https_property_value": "https",
"connection_timeout": 5.0,
"default_port": 9100 // 默认端口。假如上面的http和https参数变量填的都报错,系统就会默认使用这个端口号,加上当前组件的主机名,构成一个web ui链接。也就是http://hadoop1:9100
},
"reporting": {
"ok": {
"text": "HTTP {0} response in {2:.3f}s"
},
"warning":{
"text": "HTTP {0} response from {1} in {2:.3f}s ({3})"
},
"critical": {
"text": "Connection failed to {1} ({3})"
}
}
}
}

port和web其实是一样的,只是port是端口,而web是一个web ui的界面,本质其实也是端口

SCRIPT类型

1
2
3
4
5
6
7
8
9
10
11
12
13
"ELASTICSEARCH_HEAD": [
{
"name": "es_head_check_process",
"label": "elasticsearch-head check process",
"description": "check elasticsearch-head process",
"interval": 1,
"scope": "ANY",
"source": {
"type": "SCRIPT",
"path": "HDP/3.1/services/ELASTICSEARCH/package/alerts/alert_check_dir.py"
}
}
]

这是一个自定义的告警规则,需要在HDP/3.1/services/ELASTICSEARCH/package/alerts/alert_check_dir.py这个目录下创建自定义的告警规则

1
2
3
4
5
6
7
8
9
10
11
12
13
14
15
16
17
18
19
20
21
22
23
24
25
26
27
28
29
30
#!/usr/bin/env python
# -*- coding: utf-8 -*--

from resource_management import *
import os
import socket

def execute(configurations={}, parameters={}, host_name=None):
config = Script.get_config()
elastic_head_pid_dir = config['configurations']['elastic-env']['elastic_head_pid_dir'].rstrip("/")
elastic_head_pid_file = format("{elastic_head_pid_dir}/elasticsearch-head.pid")

result = os.path.exists(elastic_head_pid_file)
if result:
result_code = 'OK'
es_head_process_running = True
else:
# OK、WARNING、CRITICAL、UNKNOWN、NONE
result_code = 'CRITICAL'
es_head_process_running = False

if host_name is None:
host_name = socket.getfqdn()

# 告警时显示的内容Response
alert_label = 'Elasticsearch Head is running on {0}' if es_head_process_running else 'Elasticsearch Head is NOT running on {0}'
alert_label = alert_label.format(host_name)

return ((result_code, [alert_label]))
#返回的第一个参数是告警状态,第二个参数是响应内容

这里的python脚本必须重写一下execute这个方法,三个参数缺一不可